For years, Business Intelligence (BI) and Enterprise Analytics solutions have been providing business users with access to mission-critical data, and for years, these tools have been saying they are going to “kill the spreadsheet”, and improve your business process by doing so. And for years, each and every solution has fallen short of this goal. The truth is that spreadsheets are an incredibly powerful tool because they contain two very core values:
- Flexibility
- Composability
Flexibility in that users have full power of the contents of each cell. The cells can be numbers, text, images, formulas, and they can be arranged in any way the user sees fit. This flexibility ensures that the user is never blocked because they are doing something the original developers of the spreadsheet application could have never predicted.
Composability is crucial because there are many complex spreadsheets. For example, I may have hundreds of line items for revenue, and hundreds for costs, but once I sum both up, the Profit is a simple “A1-B1”. Since I can validate and understand intermediate steps, I can easily verify and debug my math. I never have to look at an overly complex formula, and I can even rename A1 and B1 so that it’s human readable Profit=”Revenue-Cost”, simple!
Cloud-based BI solutions have never been praised for their flexibility nor their composability. They are simply not areas where BI excels (1). Where cloud-based BI does excel is:
- Dynamacism (2)
- Single system of truth
Dynamicism is needed because your data is constantly changing. The records you care about today, may not be the records you care about tomorrow. You may have three territories when you created that spreadsheet, but next quarter you have two more. Your direct reports could be changing every quarter. Spreadsheets have always had trouble with variable sized content. There may be workarounds, but you will always be living in constant fear that somebody will break your formulas, and that could ruin your weekend (3).
The Current Problem
A single system of truth – we’ve all been there. You’re in a meeting proposing a new strategy. Somebody asks you a question. You quote a number from the spreadsheet you looked at this morning, and you’re thinking, “Slam dunk! These numbers fully justify my plan!” Then that person speaks up. You know the one. He says, “Um actually, I think the numbers you have are based on last week’s spreadsheet. You should look at the latest version.” And there you are, publicly humiliated. You look lost and out of touch with what’s going on, all because there are multiple systems of truth floating around your office. Spreadsheets have actually gone far to “TRY” to solve this issue. From Excel macros to populating data from API’s. Nowadays, with a little bit of work, you can have automatically updating data, but it’s still really hard to combine the dynamicism and constantly changing source data without breaking any dependent formulas. I think we can safely say this is not a solved problem.
So I’m not going to continue the hubris of my predecessors and say “We’ve done it. We’ve invented something to kill the spreadsheet” because we haven’t and I’m still a big fan of them (4). What I will say is “We(5) have invented something new that combines the best of both spreadsheets and BI, that in the end could have all of the core benefits of both with almost none of the drawbacks”.
The Solution
Einstein Analytics has a really cool tool called the “Compare Table.” The Compare Table mashes up BI and Spreadsheets in an easy to use, intuitive way. It’s really simple. The columns are completely user controlled, and the rows are defined by the data using any user-specified grain.
 For example, every row could be a year. Column A could be the sum of Amount where Stage is Closed Won and Column B could be the sum of Amount where Stage is Closed Lost. You may be thinking, “That’s nothing new! I can easily recreate that with a pivot table!” However, what you can’t do with a pivot table is create a third column, C, that is defined as the formula “A/(A+B)” which is the Win Rate percentage. Column D could be the maximum number of days to close a deal. Column E could be the average number of cats each customer has (6). It’s really completely flexible.

The secret sauce is what I like to call “Partial Measures” (7). Partial measures only compute the aggregate for those rows matching an additional filter. Like Sum of Amount where Stage is Closed Won, or Count of Opportunities where Close Date is FY2017Q1. Then we add in formula columns to get composability (remember when we talked about that above?) The best part is the formulas remain even easier than a spreadsheet. There you would have to type “=A1/(A1+B1)” then grab that elusive bottom right corner and fill down, and tomorrow, when you add some more rows, you need to remember to grab that last cell and fill down some more. In the compare table, “A/(A+B)” is much more concise and readable.
Now you may be saying, “This is all fine and dandy, but all of my spreadsheet formulas are not intra-row! What about B2=B1+A2 and fill down?” Well to answer that question, we have to introduce a new term “Window Functions.” Window functions are like formulas, but they let you specify information from other rows relative to the current row. We could do an entire blog post on window functions, so I’ll stick the basics. A window function specifies a range of rows (window) relative to the destination of the result. For example, sum everything back to the current row would be a running total, or an average of the past 4 quarters could remove seasonality from your data. Window functions also have a “Reset group.” The reset group just means, ‘if this value changes, reset the window function like you’re starting from scratch’. This allows more flexibility when let’s say, there’s a hierarchy of Sales Rep and Quarter. I may want to have a running total of each Sales Reps amount, but when I get to a new Sales Rep, we want to reset the amount back to zero. In this case, my Reset group would be “Sales Rep.” Window functions can be more stable than spreadsheet formulas because, in any business, hierarchies change. If you were to say, add a team member, somebody would need to add some rows to the spreadsheet, copy or fill some formulas, and possibly debug any copy and paste errors (or missing “$” characters, ugh!)
You must be thinking, “These window functions sound hard, and there must be an arcane syntax to learn over a 5-day course to master them,” and I’ll tell you “Not so!!!” Here’s the UI in the formula editor for the most complex type of window function we have, the “Sliding Window”:
Column – Choose the source column to reference
Function – How do you aggregate the window of values (sum, average, min, or max)
Start – The starting point of the window relative to the current row (0).
End – The ending point of the window relative to the current row (0).
Reset Group – If this value changes, start the calculation over.
The above image would take the average of previous and current values of the column A which is the count of rows, and put that value in the current column.
Once you’re done creating your tabular data, just like a spreadsheet, you can now drop that data into beautiful charts, but only Einstein Analytics gives you smooth animations and the power of faceting! (8)
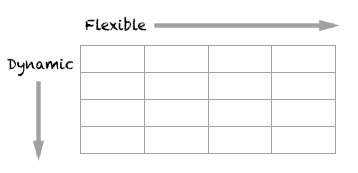
So in summary, Compare Tables are great because they combine flexible (columns) and dynamic (rows) interaction models. They allow you to do computations compositionally and hide your work as needed. Partial measures give you increased flexibility to compare across one or more aspects. Formulas let you do intra-row calculations, and window functions let your do extra-row calculations.
Happy comparing!
Further Resources
Learn more about compare tables on Trailhead with Calculate with the Compare Table unit in the Explore with Analytics Trail.
Footnotes:
- Yes, that pun was intentional.
- Yes, I tend to make up words, but you know what I mean.
- It could instead be your evenings, but it’s never your workday because nobody edits spreadsheets during a workday.
- As Weird Al Yankovic says, “They call me the king of the spreadsheets. I got ’em all printed out on my bedsheets!” But can you name the source?
- By we, I’m not really even including myself, most of the credit goes to Vijay and the original employees of EdgeSpring. I really only presided over making it available in multiple colors which if you go by the precedent of the iMac and iPod, is pretty much just as important as creating it.
- It could be dogs too, but no other animal types are currently supported. We look forward to adding them in a future release (safe harbor).
- A term similar to “Partial Functions” from the Scala programming language
- Faceting is this really cool feature in EA dashboards where selections on one widget are instantly added as filters to other widgets so that you can see everything else in the context of your selection.