Visualize and unify data to drive real-time insights at your company
Data
New Here?
Latest Blog Posts

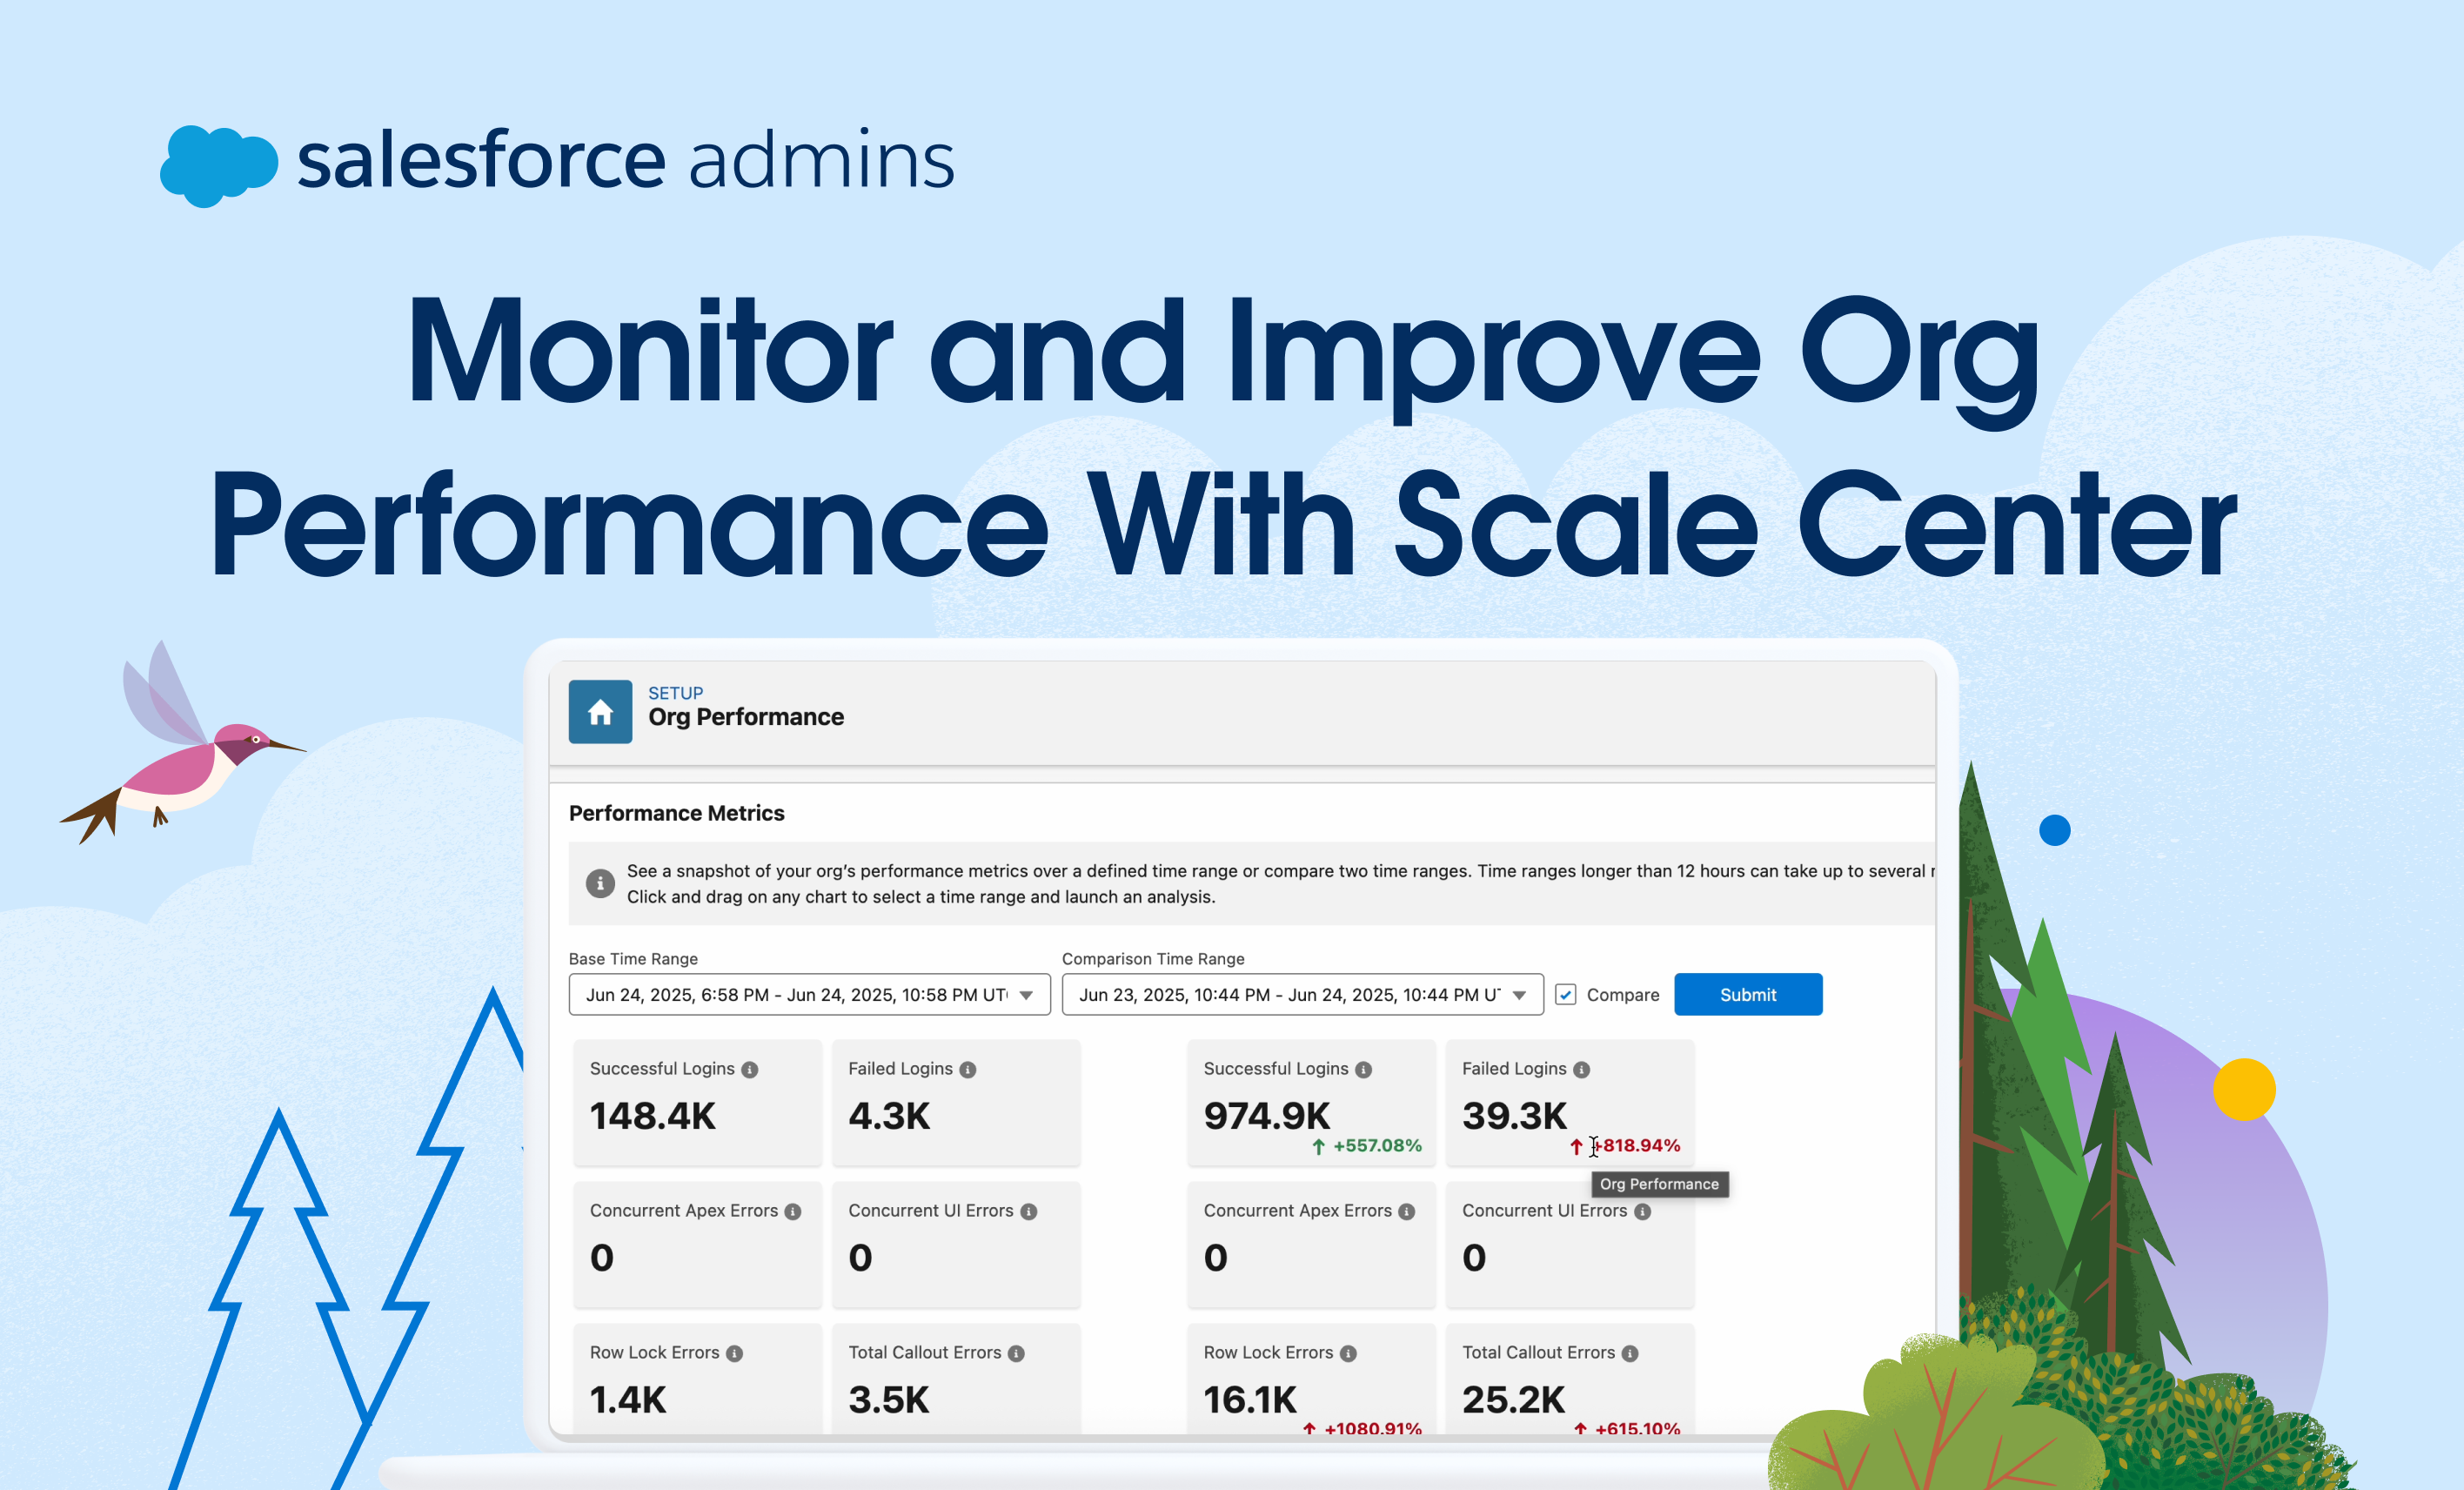
As a Salesforce Admin, you’re the guardian of your Salesforce implementation. You’re the first line of defense in keeping your org running smoothly, supporting users, and ensuring your setup is stable and scalable. So when someone says, “Salesforce feels slow,” you’re expected to have answers—fast. Until recently, getting real performance insights often meant logging a […]

As a Salesforce Admin, you’re the first line of defense when it comes to keeping your org running smoothly. From supporting users to monitoring performance and planning for growth, your role is essential in ensuring your org is stable, scalable, and set up for success. That’s where Scale Center and ApexGuru come in. These tools […]

As admins, you hold the keys to success for your users and companies to get the most out of Salesforce. You have the unique opportunity to build and manage trusted solutions that drive productivity and innovation through five admin core responsibilities: security, user management, data management, analytics, and a new core responsibility: product management. The […]
Videos
Right now, businesses like yours are capturing and managing more data than ever: everything from web and mobile clicks to shopping cart data, location data,…


