Editor’s note: This post was updated on May 30, 2023, with the latest information and resources.
Understanding how to create data sets in Salesforce is key to creating accurate reports. The data you and your users want to report on is not always stored in records from a single object. Many times you will need to join data together from various objects to create meaningful reports.
The methods to join data from different objects in Salesforce rely on the explicit relationships that you set up (master-detail and lookup fields). But with so many ways to join data together, it’s crucial to know when to use each method.
We will be utilizing custom report types and cross filters to create the following data sets in part 1 of this blog series:
- Records from one object
- Parent records with child records
- Parent records with or without child records
- Parent records without child records
Here is the Trailhead module on reports if you are brand new to Salesforce or need a refresher.
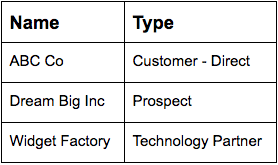
And here is the sample data we will be using:
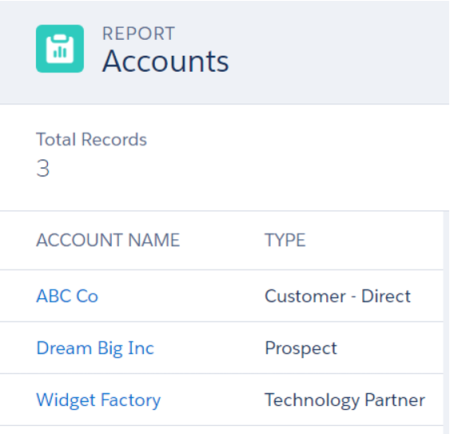
Parent Records (Accounts)
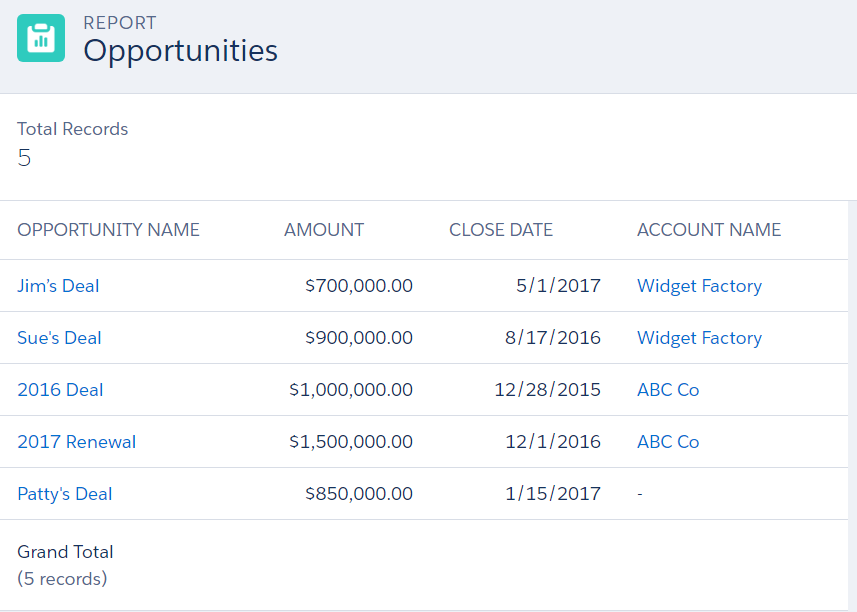
Child Records (Opportunities)
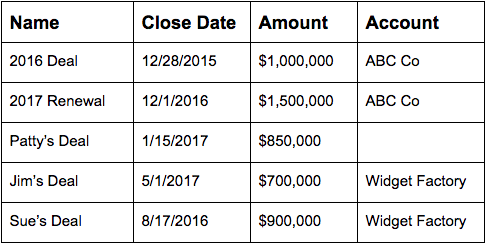
The account table is the parent object and the opportunities table is the child object. This is accomplished by a lookup field on the opportunity object that can optionally specify an account record.
Records from one object
This is as simple as it gets. There are no joins when creating this kind of report. Analogous to a list view in Salesforce, when you only specify one object in your report type you will only have access to the data stored in the fields defined on that object. Every row in this data set represents a record. If there is no record, there will be no row in the data set. This is due to the concept of the “primary object”, which determines the focus object for a report type. If there is no record from the primary object, we will not see a row in our data set. In the sample data above, each table is already showing what the resulting data set would look like. Here is the account data set:
And here is the opportunity data set:
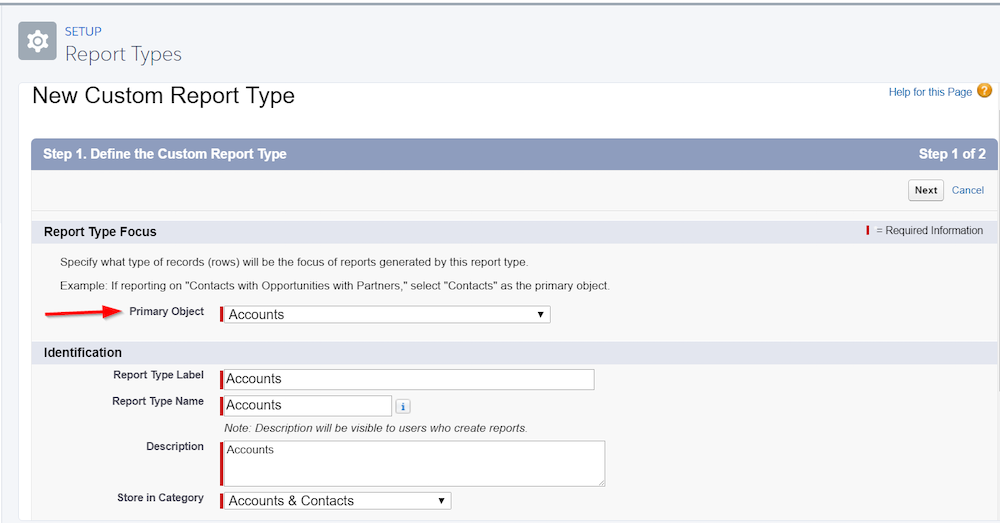
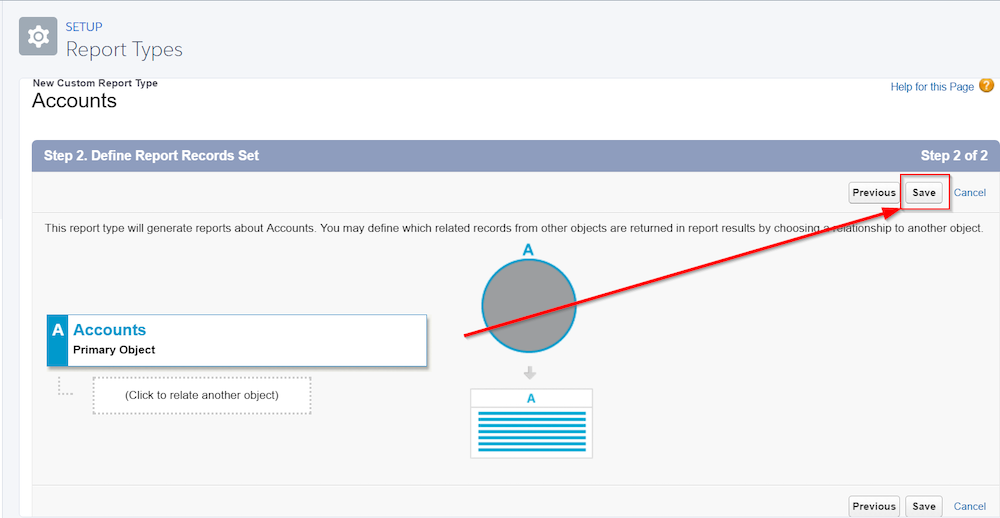
Many standard objects already have a report type simply titled the plural name of that object – “Accounts”, “Opportunities”, “Campaigns”, etc. For custom objects, this report type will exist if there are no master-detail relationships defined and you’ve set the “allow reports” option to true in the object definition. Otherwise, you will have to create this report type yourself. When creating the custom report type, select the desired object as the primary object in step 1 and don’t specify any other objects in step 2.
Parent records with child records
There are two ways to interpret this scenario:
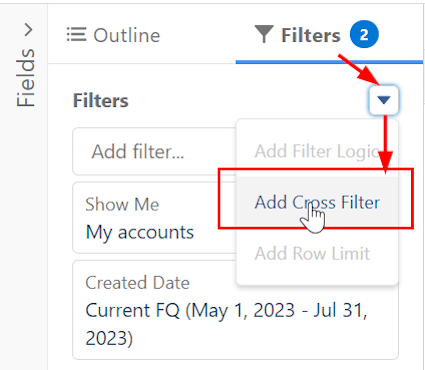
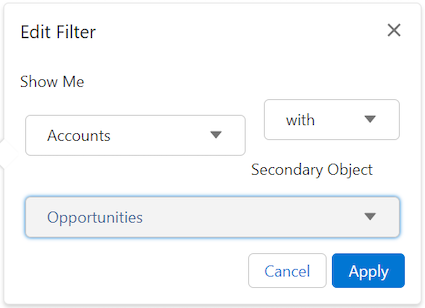
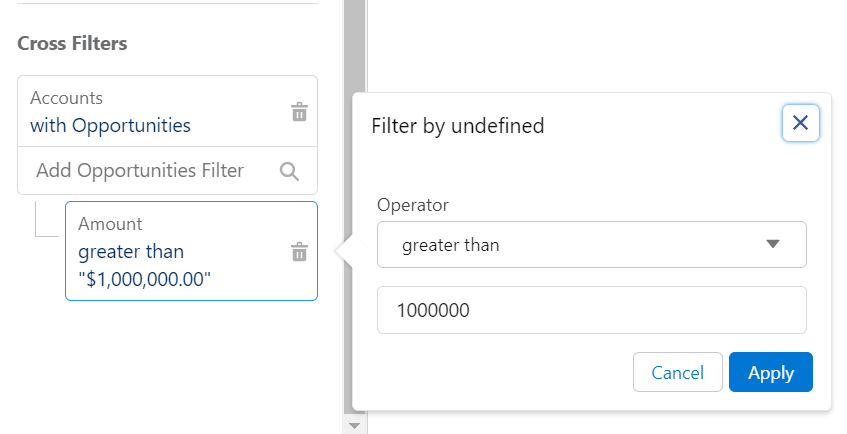
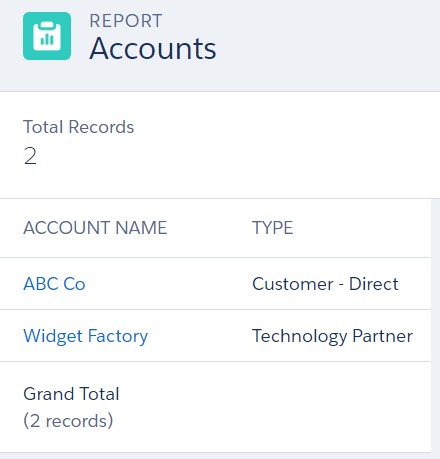
1. Display a row for each parent record meeting filter criteria that is based on child record data. In Salesforce’s report builder, this is accomplished by way of a Cross Filter – which easily allows you to display a deduplicated list of parent records. Here’s an example showing just the accounts that have opportunities with amounts greater than $1,000,000.
2. Display a row for each record in the child object that specifies a record in the parent object. This is an “inner join” in SQL terms. More on inner joins here. The “join” occurs when the ID of a parent record matches the ID specified in the lookup field on a child record – giving you the ability to reference data from a parent record on a row that represents the existence of a child record. Using the sample data above, we should expect to see a row for every opportunity record that specifies an account record. A picture is worth a thousand words here – the resulting data set looks like this:
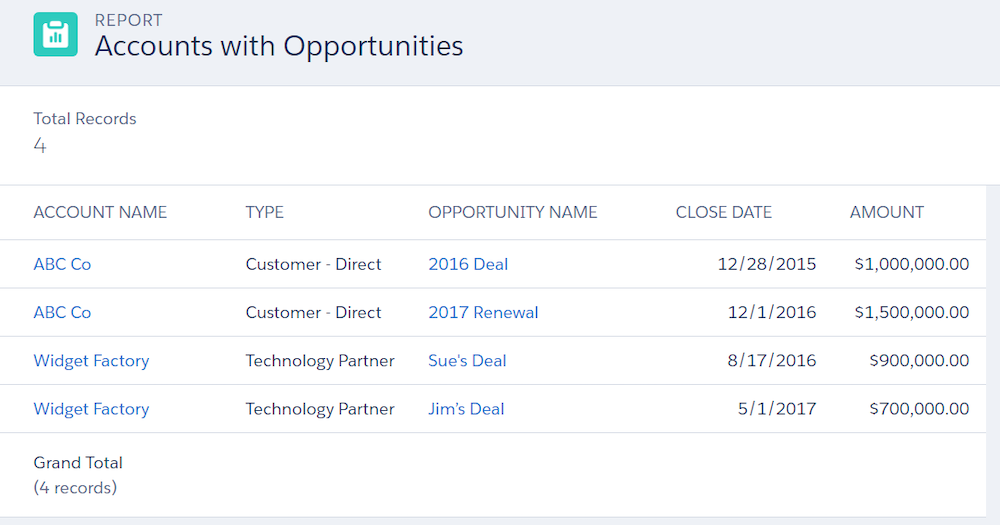
Notice that the “Dream Big Inc” account and the “Patty’s Deal” opportunity are not represented in this data set. This is because the “Dream Big Inc” account does not have any child opportunity records and the “Patty’s Deal” opportunity record does not specify an account record. Since our primary object is “Accounts” in this report type, a record will not be represented unless it is related to an account record.
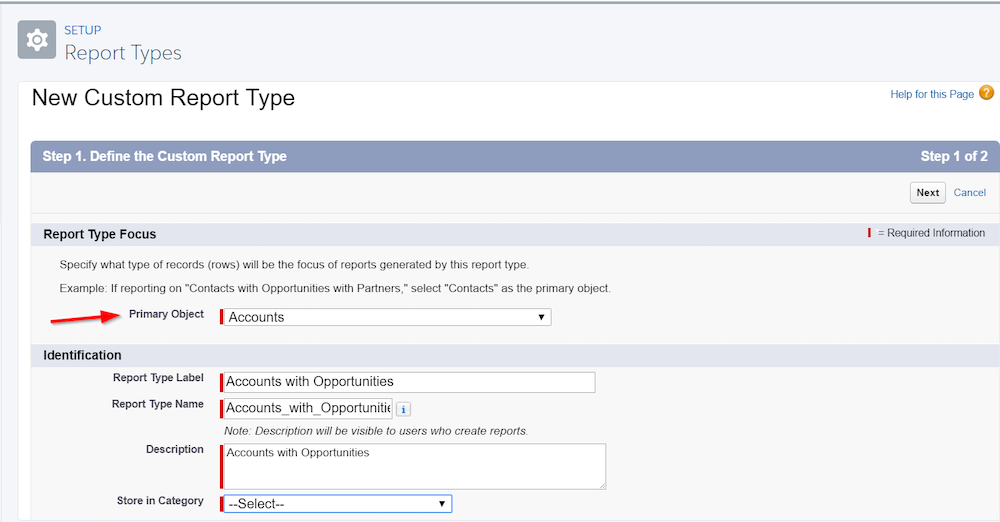
Setting up the report type is simple: First, choose the parent object as the primary object.
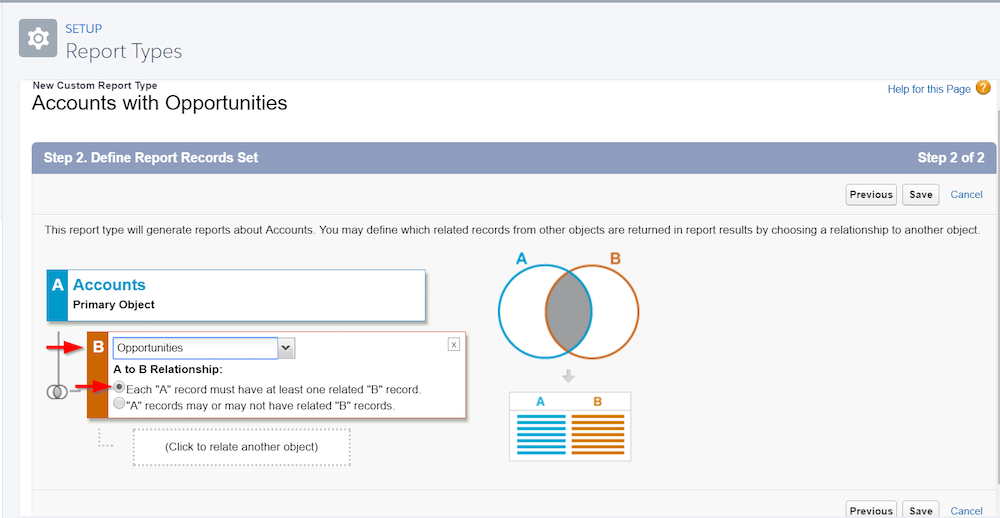
Then, choose the child object as the related object.
Be sure to specify the option for “Each “A” record must have at least one related “B” record.”
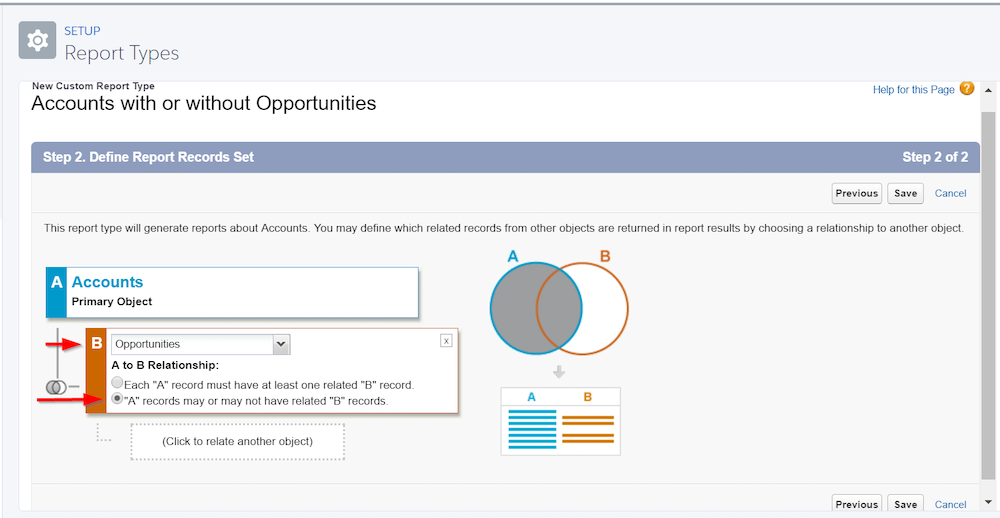
Parent records with or without child records
This is a “left outer join” in SQL terms, which means the resulting data set will display a row for every unique combination of matching records between the two tables, and then will show a row for every parent record that does not have a child record. More on left outer joins here.
Using the sample data above, the resulting dataset would be the following:
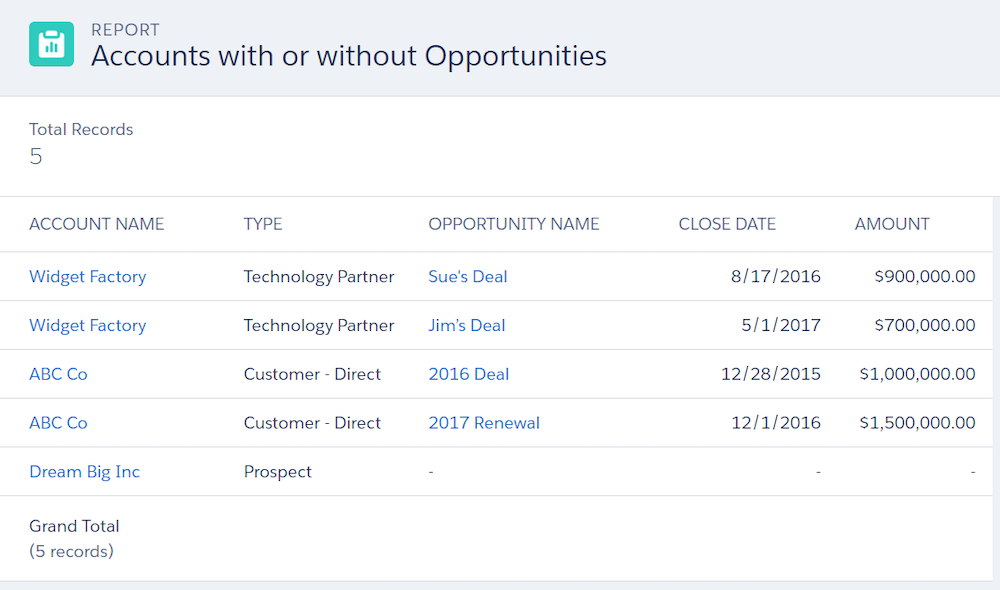
The “Dream Big Inc” account appears in this report but does not have any values showing for the opportunity fields that are included as columns. The “Patty’s Deal” opportunity record is not accessible here since our primary object is “Accounts” in this report type. A record will not be represented unless it is related to the primary object specified in the report type configuration.
Creating this report type is very similar to scenario #2. Just be sure to specify the option for “ “A” records may or may not have related “B” records.”
The filter behavior in a report using this configuration is unique – a filter based on a field from the parent object will affect all rows shown for the parent record and its child records. But a filter based on a field from the child object will only affect rows shown for the child records – even if that filter eliminates all child record rows, the parent records will still be displayed as rows. This can be desirable when you want to analyze a set of parent records, summarize a subset of its children, and keep the parent records included even if they have no child records meeting the filter criteria.
Parent records without child records
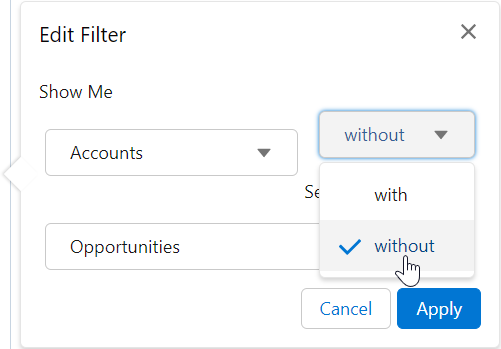
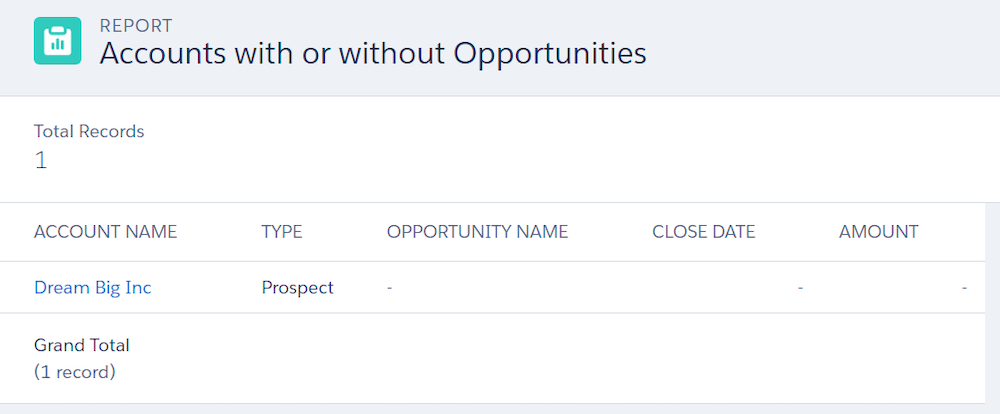
There are two reports types you can use to accomplish this one. One option is to start with the “Accounts with or without Opportunities” report type we created in scenario 3 and then use a cross filter within a report to ensure we only include Accounts that do not have child opportunities.
The resulting data set looks like this for our sample data:
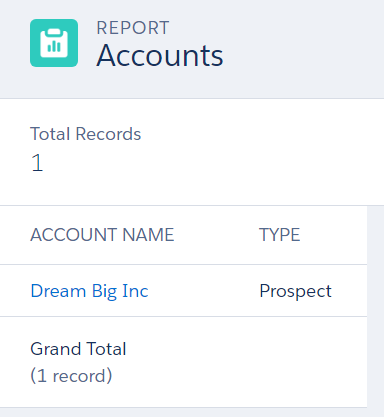
While that will certainly work, you may not need to see all the empty columns for the child object. A simpler way to accomplish this would be to use a cross filter on a basic report type for the parent object – e.g. the “Accounts” report type from scenario 1. For our sample data, the data set would look like this:
Additional resources
That’s all for now! We’ve covered the basic building blocks of report types. Check out the next post of this two-part series below where we cover three more report types that you can add to your toolbox.