We all know that a CRM is only as good as the data it holds. However, getting that data into a format that is easily accessible and discernable is not always easy. Having a solid understanding of the numerous reporting features and best practices that are available to us is an important part of any Salesforce Admin’s job.
Make your job easier with powerful features
Let’s be honest, I’m sure all of us have spent WAY too much time trying to create and format reports to provide what our users request. I have certainly done this, only to later find out about a great new reporting feature that would have allowed me to create the same reports in minutes. Here are some of the features that will provide a tremendous bang for your buck:
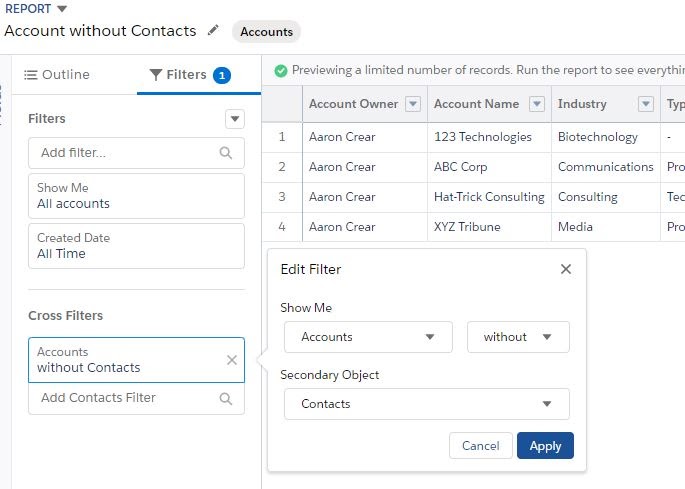
Cross Filters
Quickly identify records with or without related records.
Ex. Accounts without Contacts
Power of One
Allow objects to count themselves; use in other formulas.
Custom Report Types
Use for more complex reports on related objects.
Make visualizing the data simpler
Reports allow us to return a set of records that are the basis of our analysis. Charts and Dashboards are a mechanism for visually consuming this data in a manner that can surface trends, point out key metrics, and summarize and categorize values.
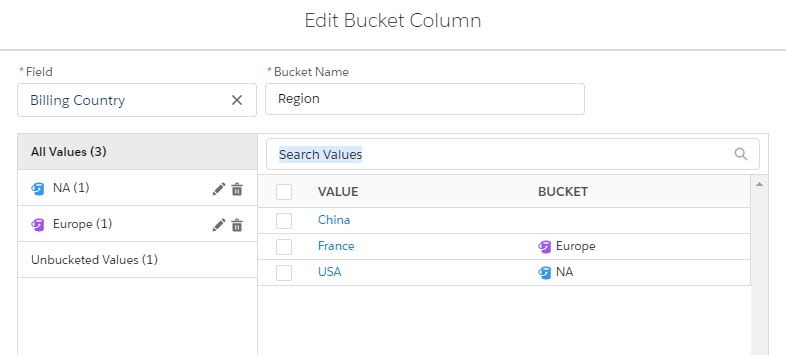
Buckets
Categorize a group of values.
Ex. Group into region based on country
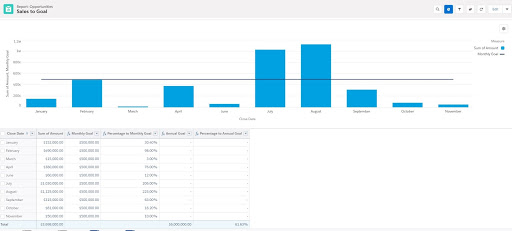
Custom Summary Formulas
Summarize numeric values.
Ex. Show sales compared to Goal
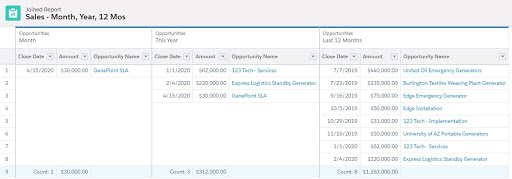
Joined Reports
Show blocks of different data points & objects in one screen.
Ex. See sales from this month, this year and last 12 months in one report view
Learn about new report features
Keeping up to date about all the new features in each release is not easy. Luckily, each release notes documentation contains a section on Analytics, which includes all-new features for Reports, Dashboards, and Einstein Analytics. The last couple of releases have had some really great new features that you should certainly take advantage of:
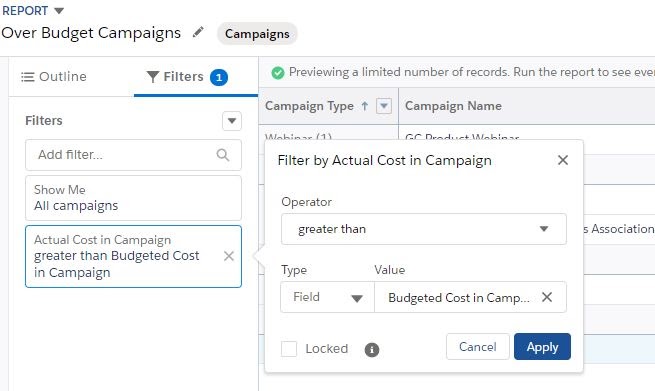
Field-to-Field Filters
Filter reports based on comparisons to other fields.
Ex. Show Campaigns with actual cost > budgeted cost
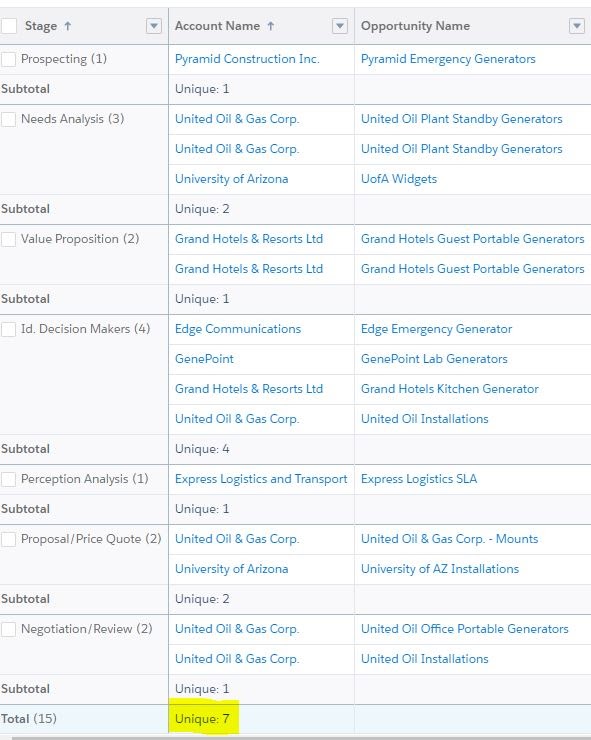
Unique Values
Quickly see how many unique objects are in your report.
Ex. How many Accounts are in an Opportunity Pipeline
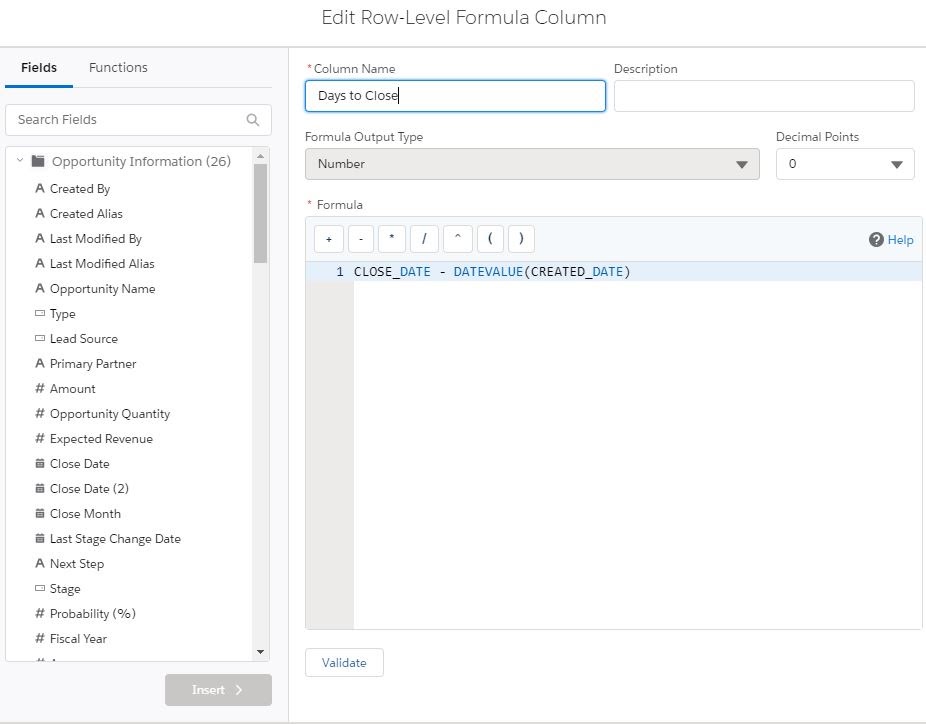
Row-Level Formulas
Reduces the need for custom formula fields on objects.
Ex. Days to Close = Close Date – DATEVALUE(Created Date)
Use Cases: An executive wants to see the number of days between when an opportunity was created and when it closed, without creating a new custom field.
Having a solid skill set in reporting is an essential skill that all admins should have and will always be in demand. Just like all of our other job skills, reporting should be continuously improved. Focusing your time on developing this portion of your toolbox will undoubtedly pay dividends to you, your organization, and your stakeholders. The tips and tricks showcased in this post will bring value to your end users, allow better decision-making to be done in your organization, and save you tons of time.
You can watch Aaron’s DF19 presentation on advanced reporting features for new admins here.
Resources
Trailhead Modules:
Add Cross Filters
Use Summary Formulas in Your Reports
Evaluate Each Record in Reports with Row-Level Formulas
Blog post: Two Additional Ways to Filter Your Reports
Blog: Getting Started with Report Formulas