Greetings, #AwesomeAdmins! Today, we discuss a practice that’s crucial to your Salesforce implementation: performance testing. It’s important to regularly measure and maintain the responsiveness of your system, especially as your usage scales. But in order for your test results to accurately reflect the performance observed in real-world scenarios, you want your test data to match production data as closely as possible. The importance of test data quality in performance and scale tests is discussed further in this blog post.
What does it mean for your test data and production data to match? Ideally, you want to have roughly the same quality and variety of test data that you have in production data. If you’re planning to run performance and scale tests, the quantity and the distribution of data play important roles, too.
In this post, we walk you through data modeling requirements and a step-by-step methodology for preparing and designing effective test data.
Step 0: Identify your use cases and test plan
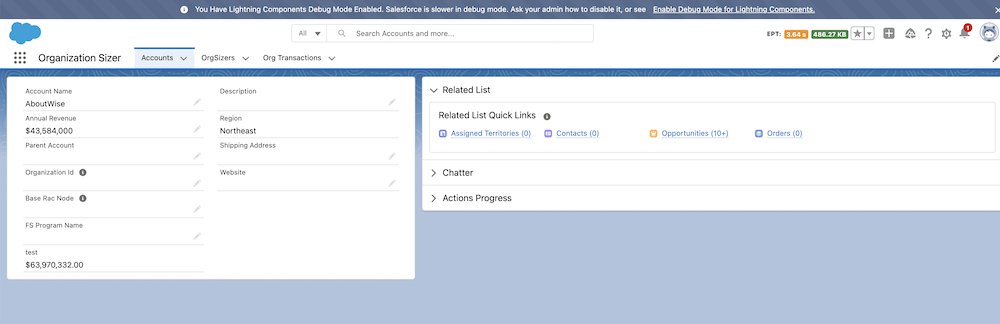
Let’s start with an example. This application provides an overview of accounts for sales agents, and further details are posted in the Related tab. The Accounts detail page for the Agent user profile is one use case.
Calculate the number of records you must create to test for your desired throughput. In our example, let’s assume that 100 users access the Accounts detail page concurrently for a test time of 75 minutes. The average test iteration time per user is 9 seconds, and each iteration requires one account record.
The minimum number of account records needed to generate this load is (75 * 60 / 9) * 100 = 50,000. If you requested a performance testing window with Salesforce Customer Service, you already made some throughput calculations. You can reuse those calculations to determine the quantity of data required for your tests. Reference the numbers you submitted in your request and use the list of scenarios you plan to run as a starting point.
Remember that different user profiles can have their own page layouts, privileges, and fields. When this is the case, make sure to take those data requirements into account as additional use cases.
Step 1: Identify the objects
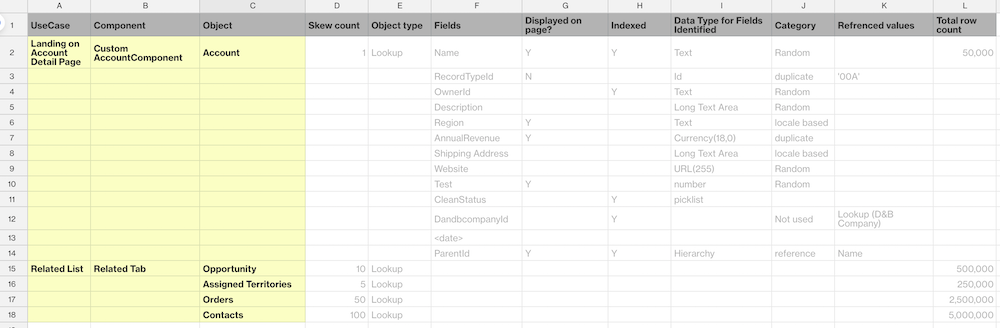
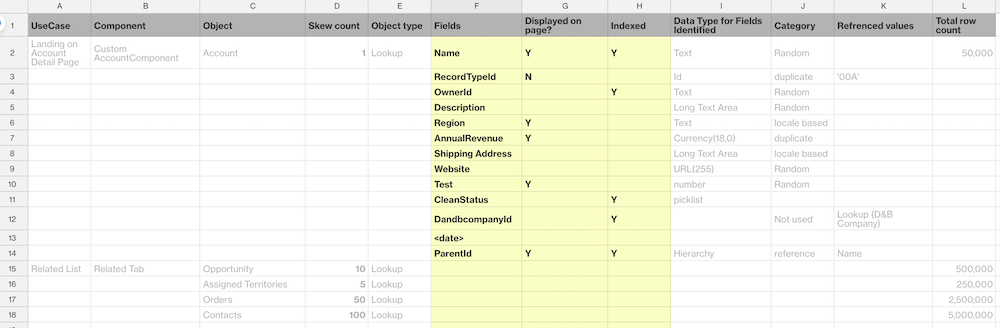
After use cases are defined for performance testing, identify the components of each use case and the objects associated with each component. Create a table to show the relationships between these entities. In our example, we highlighted in yellow the list of objects that must be populated for each use case.
Make sure your users have written permissions to create data for each identified object.
Step 2: Classify the objects
Depending on usage, we can classify the objects into two broad categories:
- Bootstrap or lookup data: This data must be preloaded into the system for the application to work. Consider lookup data to be a master list for an application, used to map business key values to their identifiers (like an ID column). You can often assign an object to the bootstrap or lookup class when you know its data seldom changes.
- Transactional data: As the naming suggests, this is the data that’s created by end users and must be loaded on an ongoing basis to do performance tests.
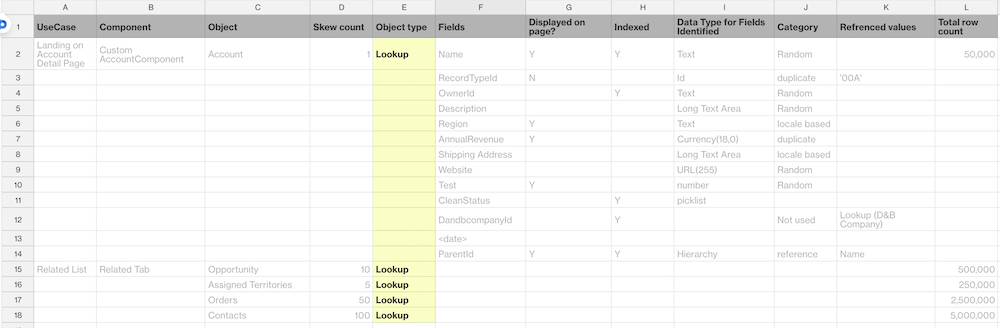
Classify and tabulate the objects as shown in the highlighted column.
Step 3: Identify the fields
The next step is to identify fields for your selected objects. It’s important to have a mix of different data types to mimic production behavior and match the structure of Salesforce back-end schema and tables. For more details, read this blog section. If your use case has fewer than 20 fields, choose additional fields to create a larger row size in the database. When choosing additional fields, select from different data types such as Picklist, Date, and Boolean.
Let’s identify fields for our Accounts detail page use case.
- First, identify the record type for the selected object. The same object can have multiple record types.
- List the fields that are displayed or looked up from the Accounts detail page.
- Include all the fields with a custom index that aren’t being used in page layout.
- Include all the reference fields.
- Don’t generate fields beyond what’s required by your use case. As a best practice, after you populate 20 fields, make sure that any additional fields are necessary.
- Identify field dependencies. For example, if a picklist has field dependencies based on record type, make sure the correct fields are populated for the use case.
- Consider data integrity validations for different fields.
- Make sure that admin users have Write access to all fields for which data is created.
Here are the fields that were chosen for our sample use case following the guidelines.
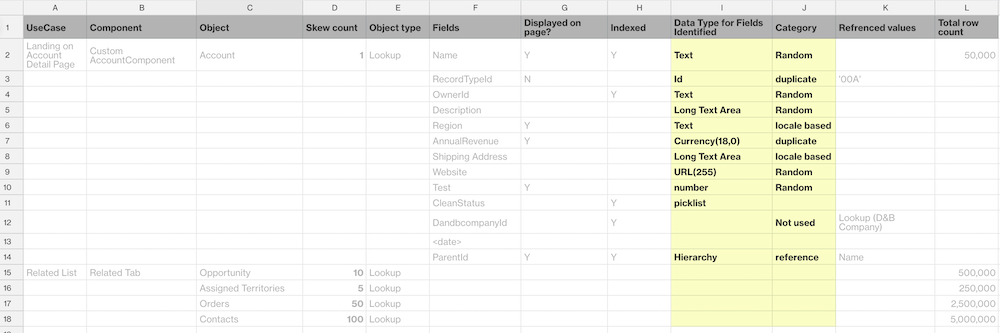
Step 4: Choose field values to be populated
Field values are determined by category, data type, and the production data mix for each relevant use case. First, assign a category for each field value, such as Unique, Random, or Duplicate. For example:
- Account numbers and SSNs are populated as unique IDs.
- Names, locales, and addresses can be populated randomly.
- Dates can be populated as duplicates. Make sure that your date ranges correspond to your test case.
A few data types to consider:
- Location
- External Lookup
- Picklist: Get the distribution of picklist data from production and populate accordingly. Remember that field dependencies can affect picklist contents.
Enter each field’s data type and category in your table. It’s always a good idea to confirm these attributes with your development team.
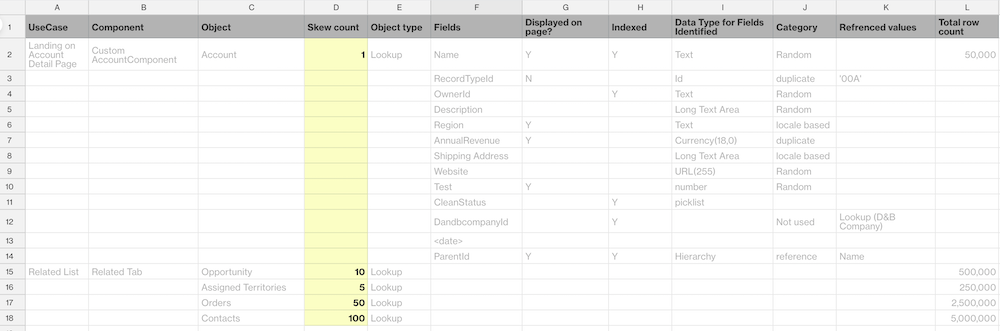
Step 5: Identify the relationships and skew
Align your test data skew with expected production data skew.
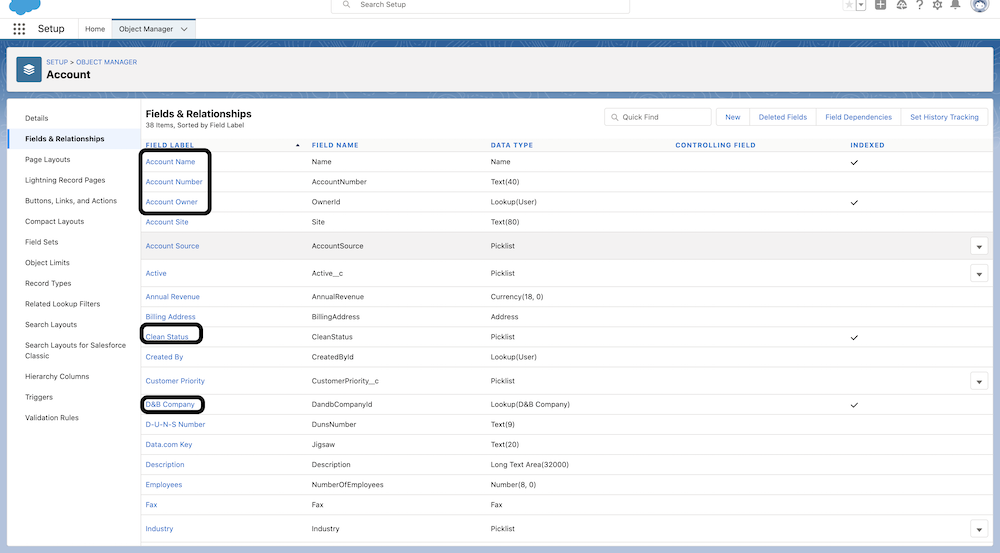
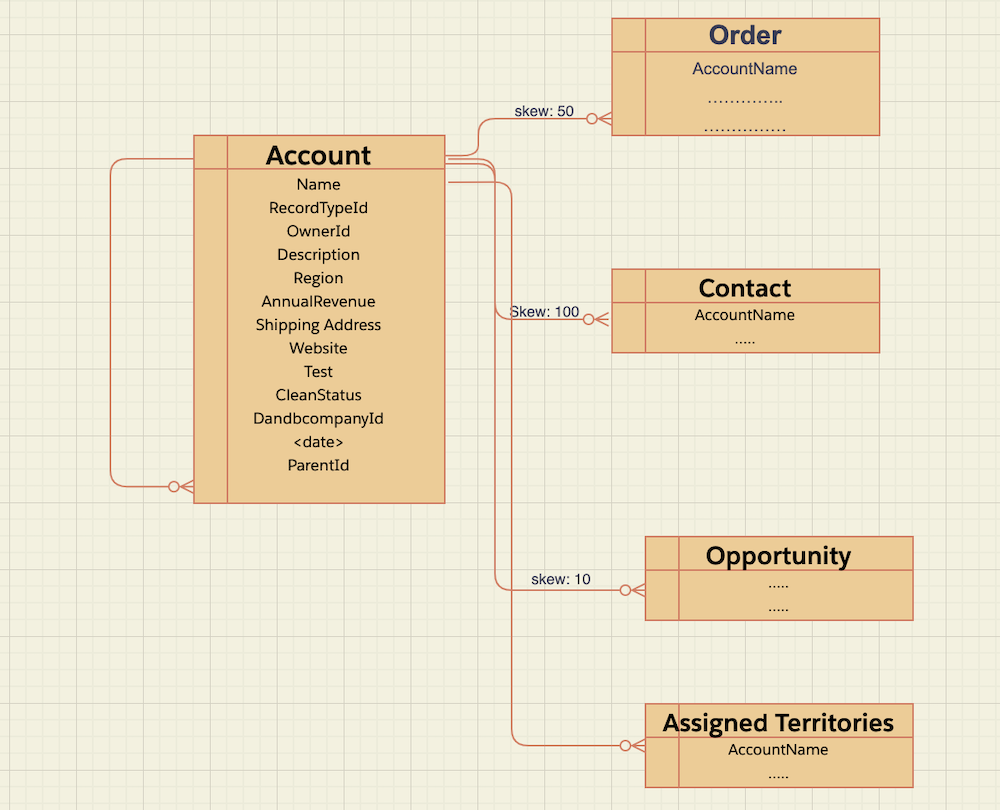
First, define relationships and dependencies among your user entities. One approach is to use Schema Builder, which clearly provides relationship types between different entities. Another approach is to derive relationships from the Object Manager page for each object. To better understand object relationships, check out this Trailhead module.
Next, determine the data skew between the related entities. In the scenario shown, each account has 100 contacts. So the skew is 1:100 between these two entities. Similarly, each account has 10 opportunities, so the skew between Account and Opportunity is 1:10. Using this logic, collect the data skew relationships that apply to your use case. For more information on parent-child data skew, read this help article.
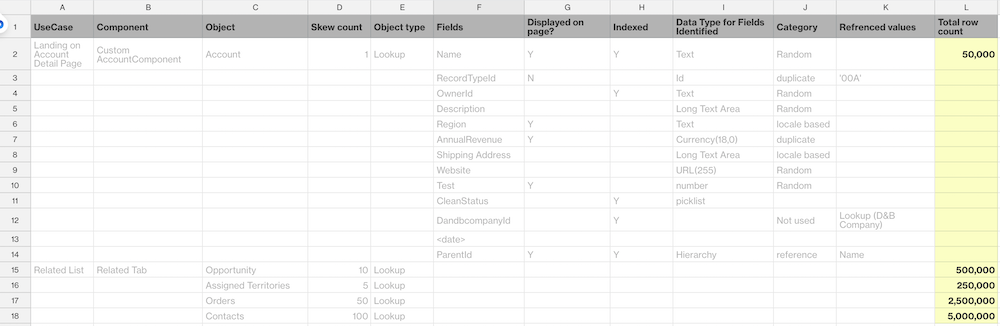
Step 6: Estimate the data volume needed for testing
After we identify the throughput requirement for our test and the skew relationships between our objects, we can estimate the required data volume based on those two parameters.
For our use case, we estimated that on a peak day, 50,000 accounts would be accessed in 75 minutes. Since the skew of Accounts to Opportunities is 1:10, we can estimate the row count, or data volume, for the Opportunity object to be 50,000 * 10 = 500,000. Accordingly, we can estimate the volume of the rest of our relational data like Assigned Territories, Orders, and Contacts.
Repeat steps 1-6 for every scenario identified. Optionally, you can create the data modeling diagram for your reference or documentation purpose.
Give it a go
And there you have it! In this post, we outlined a few simple steps that a performance engineer or admin (like you!) can take to prepare and design test data for the Salesforce Platform. To generate the data based on this process, use test data generation tools like Snowfakery. More details on Snowfakery can be found here.
Many thanks to Anand Vardhan and Shainesh Baheti for their input and contributions to this post.
Resources