The power of Einstein Prediction Builder is in how effortlessly it lets you bring your ideas into production, leveraging your valuable data to create predictions and new insights. We’ve written before about the user’s role in coming up with and creating a prediction, but what is the behind-the-scenes magic that makes things happen from there? In this blog post, I’ll go into some detail about how the data flows and is transformed through the software back end to help you gain a deeper understanding and appreciation of our product.
Salesforce and Einstein Platform
All data you enter in Salesforce is safely and securely stored in certain formats, ready to be consumed by various Salesforce products, most notably the UI that lets you see your data. Like most applications that do analytics or use machine learning, however, Einstein Prediction Builder can work more efficiently if the data is in a different, specialized format more suitable for large-scale processing. For this reason, the data is Extracted, Transformed, and Loaded (ETL) into a dedicated software platform called the Einstein Platform. Einstein Prediction Builder is just one of the products running on this powerful platform. Note that the flow described below refers to Einstein Prediction Builder specifically and not to all Einstein functionalities.
The flow of data and user actions
The following diagram gives a bird’s eye view of what happens to your data between Salesforce and the Einstein Platform, and how it ties in with the actions you take in the Einstein Prediction Builder UI. It leaves out many important software components in order to clearly explain the gist of things. Let’s walk through the components before we dive into the specifics of the machine learning flow later on.

Suppose you create a binary classification (Yes/No) prediction that predicts whether your sales opportunities are likely to be won (following the example from our previous blog post).
After you create the prediction, a snapshot of all relevant data (for example, the fields you selected as features and the target field that holds information about whether the opportunity was eventually won or not) is pulled into the Einstein Platform.
A machine learning model will be trained on the labeled opportunity data to learn patterns in the data. We’ll go into more detail on this step below. Also, for an introduction to machine learning that explains these concepts in more detail, see our previous blog post.
Several indicators of the quality of the trained model are saved, along with insights into what features the model deems important for predicting whether opportunities could be won or not. These populate the metrics and visualizations of the scorecard, which we discussed in a previous blog post.
When you approve a model in the Salesforce UI, the Einstein Platform will register this approval and activate the model.
Immediately after approval, the previously trained model is fed the unlabeled data, and it then produces a score per record that is the predicted likelihood of the opportunity being won. These scores are then saved in the prediction field that you configured during the creation of the prediction.
After the model is activated in step 5, the training and scoring cycles repeat periodically (currently monthly and hourly, respectively).
Training loop (steps 2 to 4): The machine learning model is retrained on the latest data that has received labels, and the scorecard in the UI is again updated with results from this latest retraining.
Scoring loop (steps 2, 6, and 7): The Einstein Platform will check if there are new or updated records for which predictions need to be made. If so, scoring on those records is performed, and scores are saved.
Inside the machine learning black box
Now that the big picture of how data flows and how user interactions play out is clear, we can come to the heart of things and take a closer look at the most fascinating part: the machine learning pipeline. In this pipeline, data is transformed in various ways in order to distill the insights living in your data into a useful model that can make good predictions on new records.

Data preparation
The data preparation step makes sure that all subsequent steps have clean data to work with. This means removing features (the fields you selected as inputs for the prediction) if they have attributes that are undesirable in a machine learning context. See our blog post introducing machine learning for details on what’s considered undesirable.
Examples of things to look out for include:
- Not enough data: We remove features that have too many missing values in the training or initial scoring data.
- The labeled training data looks markedly different from the unlabeled scoring data. For example, we look at the difference in their distributions and their fill rates. These are indicators that a field started being used differently, for example, because of a migration of old data from another CRM into Salesforce. This can be problematic for machine learning models, and therefore is grounds for getting rid of the feature.
- The data preparation step also breaks off the flow if, after all this cleaning, there are not enough features or records left to build a useful model. Users get alerted of such situations in the front end with an appropriate error message.
Feature engineering
You store data in Salesforce in (custom) fields that suggest a certain type of data: TextArea, Date, Number, Email, etc. One of the things we’re most proud of is that we let our software leverage that metadata to do smart, automated feature engineering. Feature engineering is the process of transforming your original data in ways that make the information in it more readily discoverable by a machine learning algorithm. That sounds abstract, so let’s go through a few examples together.
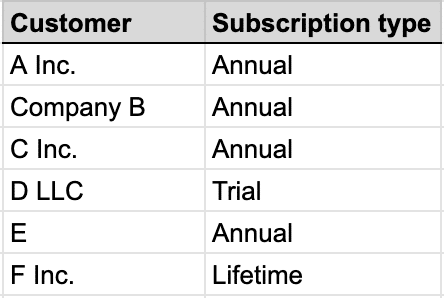
Let’s say you chose the following four fields as inputs to your opportunity prediction:
- “Contract size” (Currency field, in $ per year)
- “Subscription type” (Picklist field, with values “Trial” / “Annual” / “Lifetime”)
- “Last interaction” (Date field)
- “Customer sentiment” (TextArea field with some notes from your salespeople)
Now, because “Contract size” is a number, our feature engineering step will explore some options for transforming the data to extract more value. For example, it will use machine learning techniques to try to smartly divide these numbers into a number of buckets. Say you have the list of customers shown in the following figure. It’s a huge help for most algorithms to have a feature that groups them by their relative contract size. All this is done automatically for any numerical feature!

Both the output of the bucketization process above and the “Subscription type” are categorical, as in, the data can take one of a limited number of possible values. In order for this data to be consumable by a machine learning algorithm, it’s encoded in a different way, as seen here:
Before
After
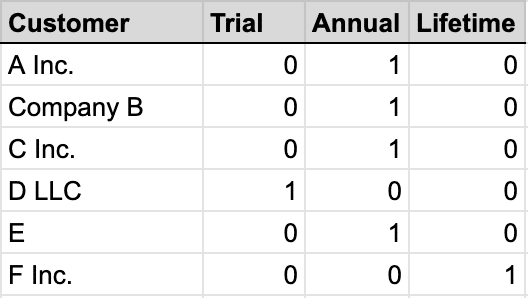
Note that if the number of possible entries is extremely large, this will result in an extremely large number of columns. This might confuse an algorithm, so sometimes we have to be judicious and only choose the categories that occur most frequently.
“Last interaction” is a date field, so there’s a range of possible interesting transformations to be done. For example, we extract the day of the week, the month of the year, the year, the number of days between two dates, and more. We’ve written before about the complications of date fields, and if you’re (considering) using them in your predictions, we strongly recommend you read that post.
Lastly, and most interestingly, the “Customer sentiment” field. Because this is a freeform text field in which the salespeople can write anything they want, it is (1) a potential treasure trove for predicting the outcome of opportunities, and (2) the most complex field to automatically transform. We use a variety of natural language processing (NLP) techniques to extract signals from text fields to then feed into our models. Since NLP is a deep and fast-moving field of machine learning, it’s an active research subject for us. We frequently experiment with state-of-the-art methods such as pre-trained word embeddings, sentiment analysis, and neural networks for engineering features that are both useful for modeling and human interpretability.
At the core of all the transformations above (and many more!) is a state-of-the-art software library called TransmogrifAI, which we have open-sourced.
Feature selection
Our feature selection step is partly about choosing the most promising features with high information content, and partly about dropping features that are “too good to be true.” We’ve written before about the problem of “label leakage,” where during model training there is information in the input that contains information about the expected output, leading to an unhelpful model that does not perform well without this information when it’s time to make predictions.
Salesforce data scientists spend considerable effort building ways to automatically detect these so-called “leakers” using a lot of fancy mathematics. In essence, we remove features that are too strongly related with the label. We use a variety of correlation measures that can suggest such relations for different types of data. Imagine you have a “Date that contract was signed” feature in the opportunity example. Our software would pick up on the correlation between that and the target “Opportunity was won” label and remove it from the feature set.
One conclusion here is that even if a user accidentally includes leakers in the fields available to the prediction, this step will likely remove them from the training data. On the other hand, users will need to remain vigilant about introducing leakers, since this is a very difficult problem for which there is no perfect automated solution.
Finding the best model
Next, we’re ready to train some machine learning algorithms to capture the relationships in the data. These mathematical techniques come in various flavors, such as linear or logistic regression methods, decision-tree-based methods, etc. These algorithms all come with different knobs to tweak their performance in various ways.
We let the various candidate algorithm compete in a tournament, while optimizing their various knobs, and we store the best-performing models for when we need to make predictions.

Calculating metrics
Finally, a wide variety of metrics are calculated and stored after training. These are used to populate the scorecard in the Einstein Prediction Builder UI, where you can explore them. There are separate groups of metrics for:
- Numerical predictions, for which we want to express how close the predicted numbers were to the real numbers. Example: R-squared.
- Yes/No predictions, for which we want to express how often a model correctly predicted the Yes/No situation. Read our blog post about understanding the quality of your prediction for more details about such metrics.
Back to you
The results of the above machine learning flow are:
- A trained model, standing by and ready to be used for predictions.
- A set of metrics and insights into the model visualized on the scorecard.
Now it’s up to you, the user, to determine whether the model seems to achieve the goals you had in mind. It’s time to consider whether the expected prediction quality in your scorecard makes you feel the model will do a good job. Or is the expected performance suspiciously high, and you are worried that you might have included leakers? In any case, check the scorecard for feature importances and see if anything stands out. You might learn something new about your data!
If everything looks good, you can go ahead and approve the model. As shown above, approval of the model means it will start producing predictions on new and updated records. The model will also be periodically updated so that it can learn things from the latest data.
Even in this brief, behind-the-scenes glimpse of Einstein Prediction Builder, we can already see that there are a lot of moving parts, from the flows of data to the intricacies of machine learning algorithms. Rest assured, there are a lot of great people continuously greasing the wheels and maximizing the value you can get out of your data.
I hope you’ve enjoyed learning something about the Einstein Prediction Builder secret sauce and reignited your appreciation for what it takes to bring machine learning into production.