Welcome to another post in the “How I Solved This” series. In this series, we do a deep dive into a specific business problem, and share how one #AwesomeAdmin chose to solve it. Once you learn how they solved their specific problem, you will be inspired to try their solution yourself! Let’s take a look at how Samantha Shain was able to use the debug log on a form created by a previous admin and solve a recurring error message.
Key business problem
While I was doing some testing in my sandbox, I encountered an error that I had never seen before. Uh-oh! The feature I was using was custom built by someone who is now long gone. However, it was working just fine in production! At first, I couldn’t tell if it was a “code” problem or an “environment” problem. How would I even figure that out?
So begins my adventure in debug logs, user trace flags, and solving the mystery error. Join me and we’ll figure it out together!
Background
My nonprofit organization intervenes in the prison industrial complex by connecting college student volunteers with people who are incarcerated to provide 1:1 or small group tutoring opportunities. They use Volunteers for Salesforce to manage their volunteer onboarding and placement process, including some custom objects and custom code built for their unique requirements.
I was in the sandbox making some routine updates, as I typically do before each semester of programming begins. As I was testing our “Scheduling Form” feature, I saw the following error, which stopped me right in my tracks: “This page has encountered an unexpected error. Please contact your administrator.” Here’s the problem: I am the administrator, and I have no idea what the “error” is or how to find it!
How I solved it
I used the debug log to compare what happens when I load our Scheduling Form, which is a Force.com site that displays volunteer slots and data for determining schedule preferences. This helped me (1) understand what the code does every step of the way and (2) find the problem!
1. Zoom in on the problem
Our Scheduling Form is custom built using Salesforce Sites. When the page would not load, I started my wild goose chase to learn if Salesforce Sites can work in a partial sandbox (they can), if anything needs to be “activated” (Hot tip: Flows and Process Builder processes need to be activated after being deployed with a change set, however, Sites do not), if there was a problem with the site URL (there wasn’t), and so on. None of the ideas that I could come up with got me closer to the root cause and I had already lost quite a few hours of sleep over this.
Soon, I learned that this problem didn’t have anything to do with Sites OR sandboxes! So, if you don’t have experience with either one, keep reading… I think you’ll be able to relate to my experience of feeling utterly stuck and then figuring a way out.
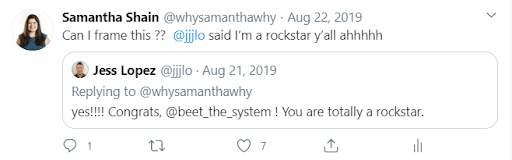
I remembered that Jess Lopez, mentor extraordinaire, had shown me a demo of how to use the debug log once upon a time. The debug log is a powerful tool that can track nearly everything that happens in Salesforce behind the scenes — from firing code to quick actions, from errors to flows, and even validation rules. (Don’t worry, it’s not tracking right now — you have to turn it on for specific time windows and users. You’ll learn how to do that soon!) I remember thinking, “One day, this is really going to come in handy!” I didn’t have any immediate opportunities to apply what I had learned, but I filed the knowledge away and resolved to learn more. Later on, I attended Jess’s Dreamforce session on the same topic
Since I knew the feature was working in one place (production) and broken in the other place (sandbox), I thought the debug log would be the best place to zoom in on the problem. I could run a debug log in each location and compare their differences. It turns out that this strategy totally worked!

2. Establish parameters for debug log in your sandbox
If you’ve never heard of the debug log, you’re in good company! Neither had I until Jess took me aside for a tutorial. And I had never actually USED one until I started to solve this problem.
To access the debug log from the Setup Menu, enter “debug logs” in the Quick Find box. Before you actually create any logs, you need to tell the system what to keep track of. It’s probably not every click of every user, right? Depending on the size of your org, that could be a huge document, plus it would be difficult to drill down to the one error you’re tracking down. Instead, Salesforce lets you identify a “user trace flag.” Let’s take a closer look:
A user trace flag is a direction you give the system for what to log in the debug log. Basically, you are answering: “Who are we tracking?”, “For how long?”, and “In how much detail?” There are a lot of options available for how you set these parameters, but I chose to keep mine as simple as possible.
- Traced Entity Type: User
This one was easy! I’ve never used any of the other options.
- Traced Entity Name: <Lookup individual user>
Just pick who needs to be traced, most likely you or potentially the person who has reported a problem.
- Start Date
- End Date
This should map onto the next time the user is going to take the action you need to track. In my case, I set the Start Date to “now” and the End Date to “5 minutes later,” which would give me enough time to go to the page, launch it, and record my clicks and any other actions. You can set the time longer if you’re dealing with more unpredictable scenarios. Just remember, there’s a limit of 1,000 megabytes of logs within a 15-minute window!
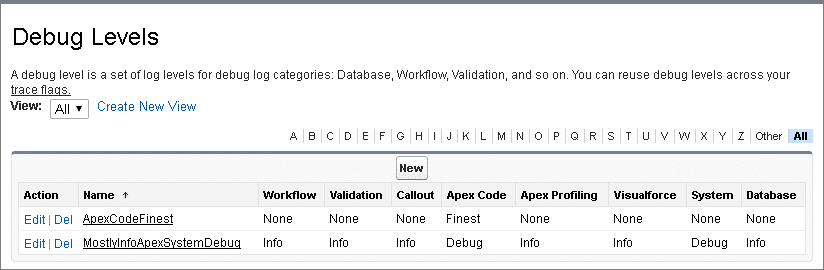
- Debug Level
SFDC_DevConsole is a “default” option that already exists in your org. My org did not have any other debug levels, but you can create others for different scenarios. Learn more here.
3. Rinse and repeat in production
Now that you set up the user trace flag in your sandbox environment, do the same in production!
4. Double, double, toil and trouble!
Now that I have the trace flags set up in the sandbox and production, I need to log in as the “traced user” and follow the same steps in both environments. That way, when I look at the debug logs, I can easily tell why the feature works in production but doesn’t work in the sandbox. So, in my case, I logged in as the “Guest Site User,” accessed the Scheduling Form, filled it out, and hit submit. Then, I went back to the debug log to review everything that had happened in the background.
You may be surprised by what I did next, since I tend to be a digital-first admin. I printed out the debug logs and went through them side-by-side with a highlighter (yes, an ACTUAL highlighter) until I found the difference between them.
The debug log gave me step-by-step instructions of everything that happened in the system when I opened the Scheduling Form, filled out data, and hit submit. I could see that there was code to open up and design the form, code for populating the Scheduling Form with custom records unique to the user’s region, code for saving my responses, and code for looking up my contact record, scheduling time slot records, and interfacing with all of the other metadata that I’m familiar with.
I felt intimidated at first, since there were a LOT of lines of code, but I just kept moving forward, one line at a time, knowing that the debug log would eventually reveal the error (and its cause) as long as I could drill down to the perfect location.
5. Compare and contrast
Several hundreds of lines of code later, I found the error! The Scheduling Form code queries Salesforce for scheduling time slots, and they had not been reproduced properly in the partial sandbox environment. The records the form needed (in order to populate the form with options) simply did not exist. Once I realized that was the problem, I was able to quickly and painlessly create a few manual records in the sandbox, and the Scheduling Form started to work again immediately!
6. Celebrate ?

Business results
At first, I thought this was just a problem with how the partial sandbox selected records to copy. However, over time, I realized that my staff sometimes forgets to make Schedule Time Slots in production, too! When this happens, it results in the same error, but this time, that error impacts real, live volunteers. Getting up close and personal with my org’s code helped me be able to (1) complete my pre-semester checklist, (2) solve this sporadic error, and (3) increase my confidence and sense of empowerment.
Now, if I hear that a volunteer has trouble with the Scheduling Form (it’s rare, but it happens!), the first thing I do is make sure that Schedule Time Slots have been created. Then, I turn on the debug log and ask them to resubmit. Hopefully, the answer was there the whole time… I just didn’t quite know where to look.
Do try this at home
Familiarize yourself with the App lifecycle
- Build your automation in a sandbox before moving into your Salesforce production environment. You’ll catch issues quickly without inconveniencing your staff!
Code is your friend
- Intermediate admins can read along and mostly understand code if they take it nice and slow! Don’t let intimidation or Impostor Syndrome hold you back!
Put pen to paper
- Getting stuck solving a problem in Salesforce? Don’t be afraid to grab your nearest analog devices. I love doodling a quick flowchart for automation, sketching a grid for reporting, or using a literal highlighter to review code.
Let us know what you thought of this solution, and tell us how you want to use it on Twitter<link> using #AwesomeAdmins #HowISolvedThis.
Relevant Trailhead Badges
- Debug and Run Diagnostics
- Developer Console Basics