Welcome to another post in the “How I Solved This” series. In this series, we do a deep dive into a specific business problem and share how one #AwesomeAdmin chose to solve it. Once you learn how they solved their specific problem, you’ll be inspired to try their solution yourself! Let’s take a look at how Michael Kolodner was able to make graphical flags on Salesforce data without document storage or image tags.
Key business problem
Sometimes, text or numbers just aren’t evocative enough to catch users’ attention at the right moment. Whether it’s in a single field, a compact layout, or a big flashing section of a page layout, there are always moments when it would be nice to have an image that conveys meaning in an instant. Research shows that our brains process images much faster than words or numbers. And if you’ve got a solid wall of numbers or words in front of you, it takes a lot of cognitive work to try to make sense of it.
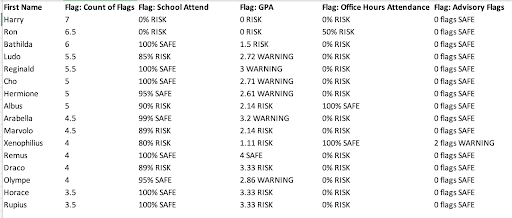
For example, the Academy Group is tracking several measures of student well-being and academic success, from GPA and school attendance to engagement with Academy Group programming and advisor assessments of well-being. Each of those metrics is calculated differently, whether attendance (a percentage), GPA (out of 4), or a count of concerns by advisors (a number). And for each metric, the cutoffs dividing low, medium, and high risk are different. Looking at numbers for all of these metrics together on a report, it’s nearly impossible to parse the different meanings. And even with text indicating the level of risk, it becomes a wall of unreadable characters.
There are existing solutions for putting graphical image flags into a Salesforce field. We can add badges using static resources, as noted in this NPSP best practice post and this Trailhead module. Those are great tips and they certainly work, but they can be a pain to maintain. And when you’re in the formula field, you don’t actually get the image that is going to display; all you get is the file name. Luckily, emoji are ready on your keyboard at any time, and when you put them into a formula, you’ll have the exact result right on screen!
How I solved it
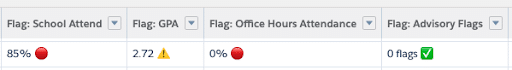
Let’s go back to the Academy Group tracking several measures of student success. By adding in an image flag, it’s instantly clear whether each measure is in a problem zone or not:
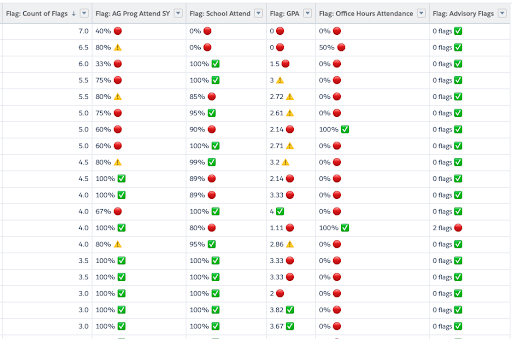
In fact, you can start to make sense of a whole report at a glance (even when we shrink it for display as a screenshot):
How did I do it?
Emoji aren’t just for texting anymore. They’ve available on any computer. (On a Mac, just hit Command+Ctrl+Space and the Emoji keyboard pops up!) You can use emoji anywhere you would normally use a text character like a letter, number, or punctuation mark.
Basically, the hardest part of the formula for each of those fields was deciding which emoji would represent each category. There are a lot of emoji to choose from, and I wanted three that went well together while adequately expressing the meanings to our users. For this chart of student support flags, I found three great options:
✅ Safe
⚠️ Warning
? Danger
Here’s the formula field that takes the value from Current GPA (a roll-up summary field) and gives the Flag: GPA field that’s on the report:
TEXT(Current_GPA__c) & ” “
&
IF(Current_GPA__c >=3.4 , “✅”,
IF(AND(Current_GPA__c >= 2.5, Current_GPA__c < 3.3) , “⚠️”,
IF(AND(Current_GPA__c >= 2.0, Current_GPA__c < 2.5) , “?”,
“?”)))
I began by simply displaying the GPA value and a space—no magic there. Then there’s a nested IF statement that showed an emoji based on which band the GPA falls into. Each of the other fields on that report worked essentially the same way.
Business results
Once those formula fields were built to display, it was a simple matter to drop them on a report together. Now, that’s the go-to report for the Academy Group’s learning team to see which students need some extra attention to get them back on track.
Bonus wins
Some of your Salesforce users might be visually impaired, using a screen reader or other assistive device. By supplementing the number indicator with a large and colorful image, some visually-impaired users will already have an easier time right off the bat. And screen reader users get automatic alt text read aloud for the emoji.
And here’s a major bonus that my report takes advantage of: Since emoji are text, you can work with them in formulas that evaluate text!
Did you notice the Count of Flags field in the left column of my report screenshots? That column is sorted in descending order, bringing students that need extra support to the top of the list. The count is actually generated from the fields with emoji in them! Red warning flags count as one point and yellow flags count for half a point, resulting in a tally:
IF(CONTAINS(Flag_Advisory_Flags__c , “?”), 1,
IF(CONTAINS(Flag_Advisory_Flags__c , “⚠️”), 0.5, 0)) +
IF(CONTAINS(Flag_AG_Prog_Attend_SY__c , “?”), 1,
IF(CONTAINS(Flag_AG_Prog_Attend_SY__c , “⚠️”), 0.5, 0)) +
IF(CONTAINS(Flag_GPA__c , “?”), 1,
IF(CONTAINS(Flag_GPA__c , “⚠️”), 0.5, 0)) +
IF(CONTAINS(Flag_Office_Hours_Attendance__c , “?”), 1,
IF(CONTAINS(Flag_Office_Hours_Attendance__c , “⚠️”), 0.5, 0)) +
IF(CONTAINS(Flag_School_Attend__c , “?”), 1,
IF(CONTAINS(Flag_School_Attend__c , “⚠️”), 0.5, 0))
Good luck writing that formula field for static resource image flags!
Do try this at home
I showed a pretty specific example from a particular nonprofit, but the principle applies anywhere. How might you use it?
Literal flags
You might also use some of the hundreds of emoji flags. (Mark opportunities where you’re bidding against a major competitor with a ?☠️, anyone?)
Top performers
I made another field for Academy Group that calculates results on a school report card and displays “4 High Opportunity ?” for those with the top aggregate results. It probably wasn’t strictly necessary, but how could I resist that trophy icon?
Maybe your largest opportunities need a trophy in their name?
Fun with currency
And let’s not forget the things you can do on opportunities with the various money symbols (? ? ?)!
The list of emoji grows every year, so you have new options periodically.
Resources